Playing with Data
Not long ago I gave a brief presentation at the IMLS WebWise conference in Baltimore. My theme was history as data. It was only after I finished and caught up on the twitter stream did I realize the point I was really trying to make: playing with data is an incredibly useful act for historians and we need to start thinking more about how to collaboratively collect, curate, and share the increasingly digitized historical record.
I should first say that the conference was fascinating. Typically mired in my own questions about fusing history and technology, it was enlightening see how libraries and museums are thinking about digital challenges, especially those at the intersection of data curation, outreach, and research. Data was the theme for the two keynote presentations; a discovery that I found at once frightening and comforting given how I had organized my own talk.
My point was to suggest that humanists, librarians, and archivists can benefit from thinking more about data. It turns out that the keynotes focused more on data in the sciences, and I was more than happy to make the case for extending their insightful comments into the humanities as well. One might say that data has been one of lines in the cultural sand between the humanities and the sciences. This is evident, I think, in the long-standing methodological tensions between humanists and social scientists.
I think it safe to say that the growth of the digital humanities means that data is becoming less anathema to humanists across the board. Increasing numbers of scholars (but still a minority, admittedly) have an greater comfort, if not facility, with raw data. They need to access it freely and be able to manipulate it various ways for their own research (and no need for complicated user interfaces).
More importantly, I argued, there can be great value in playing with historical data. By that I mean quickly searching, scanning, and visualizing data to see things that are otherwise impossible to notice. Of course visualizations are hardly new, even in history. But what is new, is our ability to take arbitrary data and see it from multiple perspectives with relatively little time, effort, and technical wizardry. The discoveries that come about from such quick and dirty inquiries isn’t meant to be revolutionary, but to raise questions that wouldn’t have emerged otherwise. This is not to argue that visualization in itself should be considered scholarship (though I do think it is legitimate scholarly work if even one can’t get credit for it these days).
Two quick examples:
The first utilizes the Old Bailey Archive, full-text archive of trials from London’s Central Criminal Court from 1637-1913. I was able to extract records that contain the word poison,
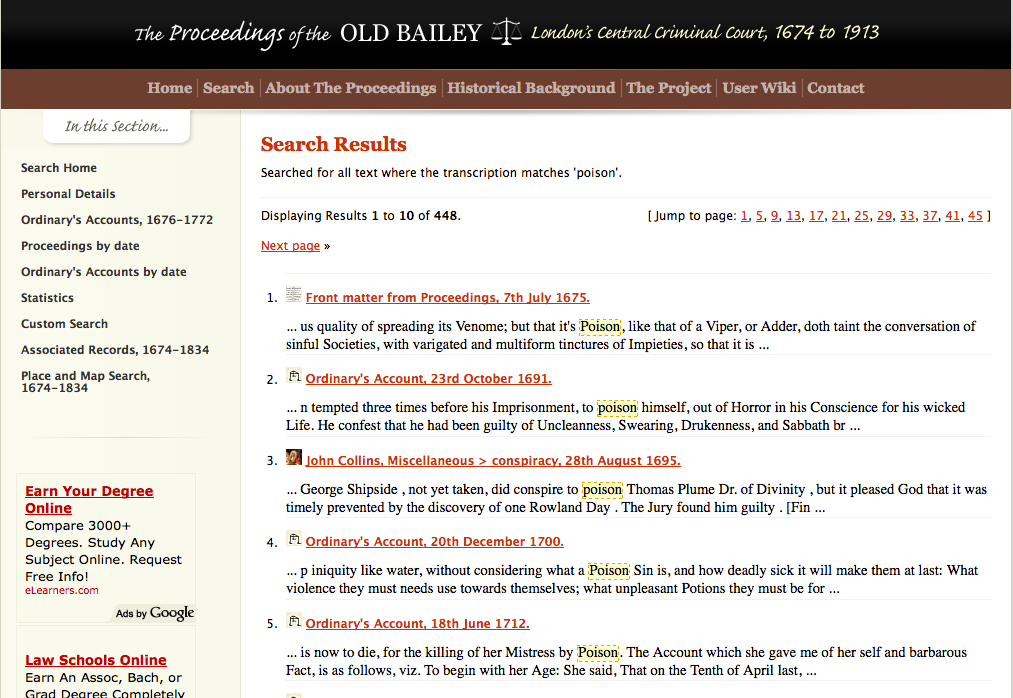
and send that data to the fabulous text-analysis tool Voyeur to better visualize what’s going on with these particular records. Filtering out the usual stop words and other words that happen to be common to trials records, like “prisoner”, I can see that “drank” is one of the more common words to appear in my search results. Zeroing in on the context of “drank”, I can see that one of words that routinely appears nearby is “coffee”.
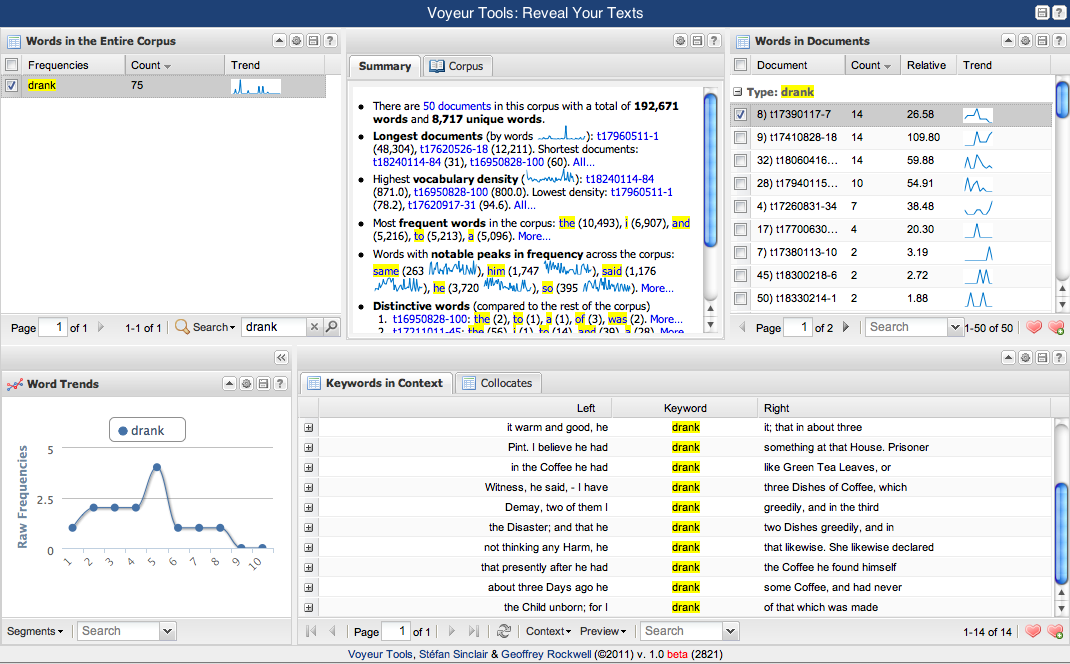
Of course it’s no surprise that a strong, bitter drink would be a vehicle for administering poison. Or perhaps that cheap coffee tasted so bad that someone, having fallen ill for any reason after drinking coffee, could feel as if they had been poisoned by it. Perhaps more importantly, I also learned that “ate” or “eaten” appears hardly at all near the word “poison”. Are these revolutionary historical observations? No. But that’s not my goal here. Rather, I’m just trying to get an informal sense of the context in which poison is being discussed. Had I read through these trial records individually, I might have noticed the frequent mentions of coffee at some point. But then I would need to go back through all other records to see what I’d missed. And this is for only a few hundred records; the task of rereading the archive doesn’t really scale to several thousand or more records, at least for practical purposes.
Although obviously not groundbreaking, the “coffee” discovery does say something interesting and prompts other questions. Maybe I should search for coffee in trial record from other archives. Are there other documented connections between coffee and poisoning? I certainly have more questions than answers. Not insignificantly, I was able to garner historical evidence (granted, from just one source in this case) about the nature of poisoning in London in just a few minutes of playing around. One could minimize this discovery by claiming its obviousness. But such an attitude discards the distinction between a priori assumptions and evidence-based historical interpretation.
The second example involves looking for references to the Book of Job in Victorian literature. One technique to find them would be to use a digital library to hunt quotations randomly, but this would be prohibitively time consuming and result in rather spotty research. A better strategy would be to break the Book of Job up into n-grams, segments of n number of words (say, 5), do the same for the largest corpus of Victorian books (which Google has already done), and look for matches between the 5 grams. Discounting common phrases, a match between 5-grams suggests a reasonable chance that the Victorian book was quoting or referencing the Book of Job.
Searching for matches across the 5-grams of enormous datasets (the 5-grams of British English is about 200GB, zipped) requires computing power that most people don’t have. Fortunately, Amazon Web Services provides a more than adequate platform for this kind of pattern matching. Doing the searching can get a bit technical and the details are best left for another blog post. For now, it is enough to say that after about half an hour of some serious (on the typical personal scale of) computing power churning away at the texts, I ended up with the number of books that reference a particular 5-word phrase in Job for each year between 1800 and 1900. This is easily, though not particularly usably graphed:
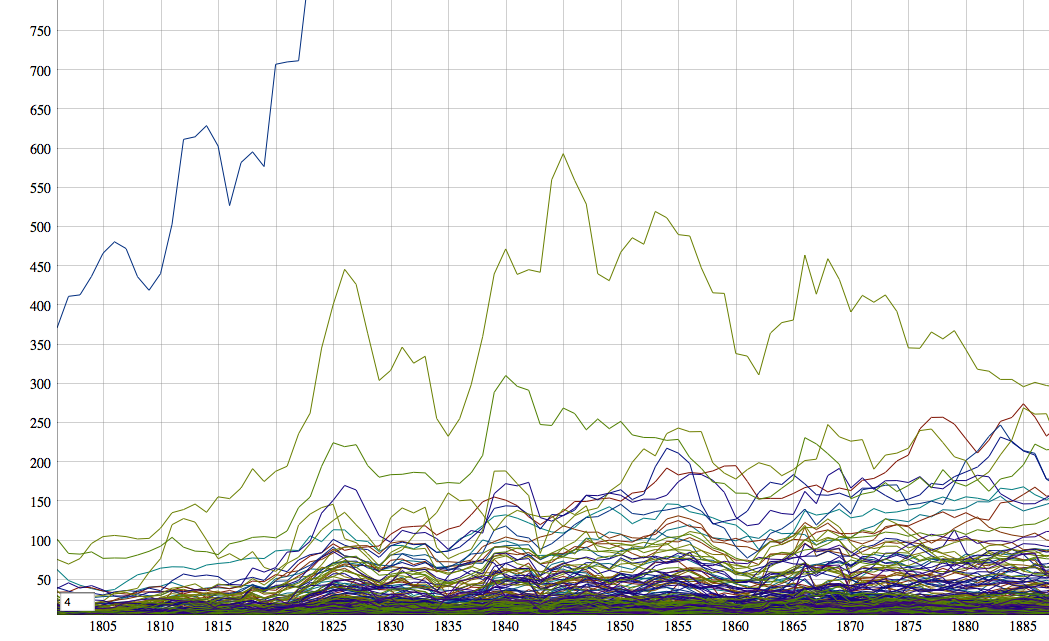
When I zoom in on the mess and set a few limits to reduce the amount of noise:
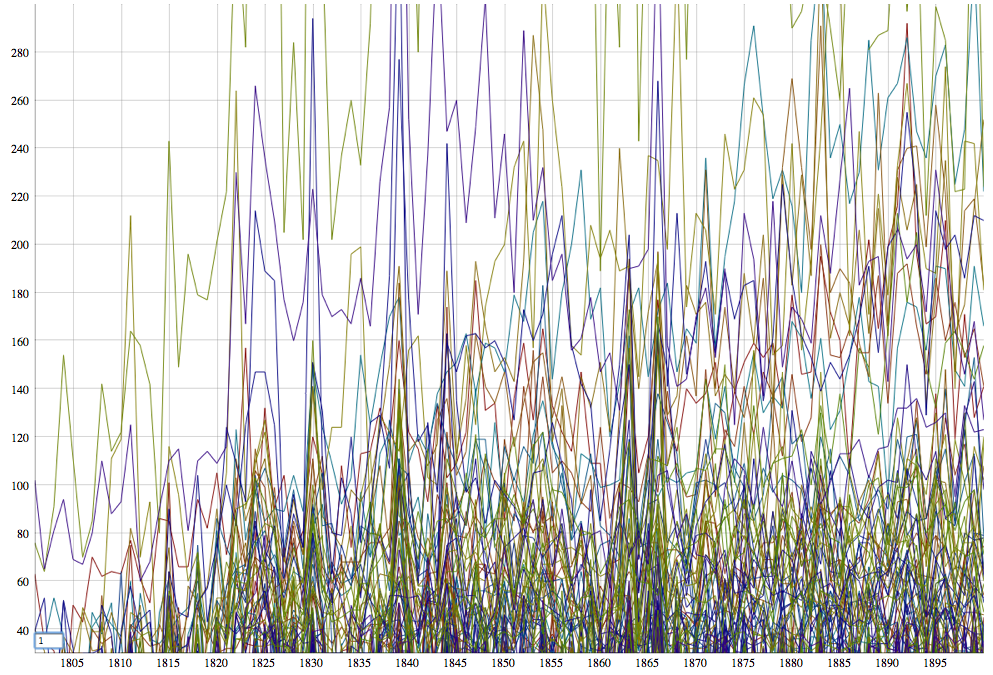
I can see a bit more. OK, it’s still a dense thicket, but there are clearly discernable spikes. A quick web search to find out the years in which editions of the Bible were published shows that these years don’t always correspond to the spikes. Obviously there are real limits to the data here, and to expect perfect correspondence would be foolish. Can we learn something about the diffusion of Bible editions through this graph that a list of editions alone cannot tell us? What do these spikes mean?
As with the previous example, I’m not attempting (or getting) any kind of historical interpretation. Far too much criticism of digital humanities tools revolves around the notion that all the new tools aren’t really doing history. To be clear: they aren’t. But virtually no one claims they are. They are, however, helping with historical research, helping to make sense of the historical record by highlighting phenomenon that would have been difficult to detect. Of course I need to learn more about the particular references that I’ve found. What is the larger context? Is there any obvious explanation of the peaks in references? More broadly: Why do some phrases deviate from the typical pattern? What do the correspondences really mean, anyway? We can also explore other data in targeted ways. What were the sciences most discussed in the later nineteenth century?
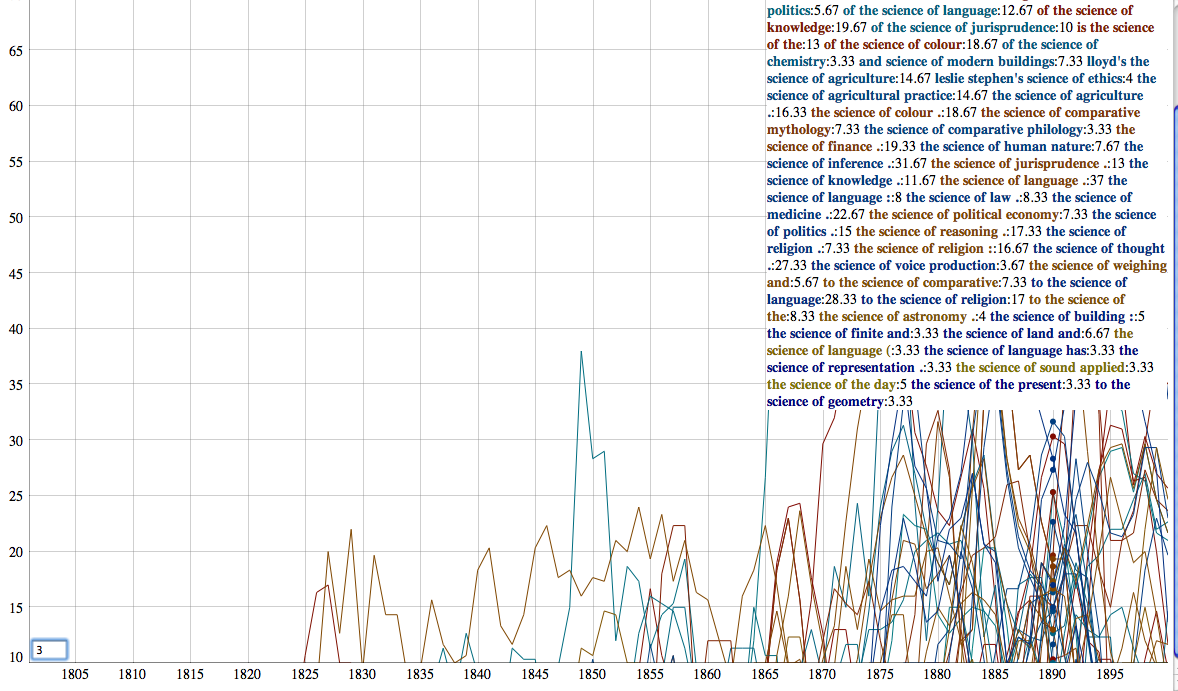
Again: the visualization doesn’t tell us what’s really going on; nor does it try. Luckily, historical data needs real live historians. My computer cannot yet tell me the significance of the frequent mentions of “the science of comparative mythology.”
These two examples imperfectly show what can happen when one is allowed to play with the data. More importantly, I think they make a case for the importance of teaching this sort of things in all kinds history methods courses, not just ones dedicated to “the digital”. How sad it would be for all historical –ism lenses to be taught only in courses dedicated to them. Besides, it’s not like we’re going to have less data any time soon. I believe it safe to say that these kinds of techniques, while obviously now limited to certain kinds of digitized archives, are only going to become more common, even in fields that don’t seem particularly inclined at the moment. For libraries and archives, it means making data available in the most flexible way. For humanists, it means willingness to play and explore, even if as a prelude to other, perhaps more traditional, methods.